
Overview
Everyone who uses R (or any coding language) needs helps sometimes. Thankfully, there is a huge community of people who like to help. When you ask for help, you are asking for other to do a little work for you. Because of this, the LEAST YOU CAN DO is to be considerate when asking your question by making it a ReprEx.
The tradition of the ReprEx
A Minimal Reproducible example, or ReprEx is a modern tradition that is “socially enforced” when asking coding questions. By socially enforced, I mean people can be snarky or unhelpful, or just refuse help, if you don’t do it.
Usually the forum for this is electronic, like Slack, Email, or other chat- or text-based format (but it is helpful for in-person help too), like the Stack Overflow forums, or the (really old) R mailing list). There are many descriptions of this practice, but these examples tend to be oriented to folks who are already programmers:
-
Stack Overflow How to create a Minimal, Reproducible Example
-
Stone Hou (detailed) How to make a great R reproducible example?
-
Hadley Wickham video (advanced example) A minimal reprex for a shiny app
Contents
0.1 ReprEx explained
All learning coders other than greenest, rank beginners know and respect the principle of ReprEx. Most people WANT to help and even LOVE to help. Help them help you.
Break down of ReprEx
The basic idea is for your problem or error to be clear and reproducible: provide enough code to be able to exactly reproduce the same error. However, unnecessary code or other information should be avoided. Questions should be “designed” to meet a few minimal requirements:
-
Provide a brief problem statement: what are you trying to do and what output you expect
-
Provide complete information, possibly including context, what you have already tried, errors, etc.
-
Provide minimum code and data (if needed) to demonstrate your problem
-
Run your own question code with a clear R Global Environment to make sure it is actually reproducible
0.2 Some examples
The following examples are real (names have been ommitted to protect the somewhat innocent).
Real question 1
trying to get my head around constructing functions. Bootcamp 1.5 arrays.' Flash challenge print first and 3rd slice of array k dimension.'  Tried various configurations with errors:
my_array = [c (, , 1:3)]
my_array [c (, , 1:3)]
my_array [dim = c (, , 1:3)]
Can't work out what the missing argument is, please help.
Tried variations of this too
array(data = NA, dim = length(data), dimnames = NULL)
as.array(x, ...)
is.array(x)
Let’s critique this:
-
Makes reference to question (somewhere on a webpage, but no URL provided even) but does not actually provide the information in the question
-
Statement of problem is incomplete (and does not actually match the problem)
-
Formatting is absent (makes it hard to see what is human textual “question part”” and what is code)
-
Not reproducible (no suggestion what the data is for my_array)
Here is the actual question from here, the “Flash challenge”” in the last code block of the section
my_vec <- round(runif(n = 27, min = 0, max = 100), 0)
my_vec # See what we did there?

length(my_vec) # Just checking

my_array <- array(data = my_vec,
                  dim = c(3, 3, 3))
my_array

# Flash challenge:
# Specify and print the 1st and 3rd slice of the k dimension of my_array
# Assuming my_array has dimensions i, j, k like my_array[i,j,k]
How could this be asked better?
### Improvement 1: make reference to the question

# I am stuck here: the "Flash challenge"" in the last code block of the section:
# https://dsgarage.netlify.app/bootcamp/1.5-m1-data-subsetting-and-manipulation/#anchor-1

### Improvement 2: Statement of problem

# The original problem:
# Specify and print the 1st and 3rd slice of the k dimension of my_array
# Assuming my_array has dimensions i, j, k like my_array[i,j,k]

# Make data
my_vec <- round(runif(n = 27, min = 0, max = 100), 0)
my_array <- array(data = my_vec,  dim = c(3, 3, 3))

# What I have tried

my_array = [c (, , 1:3)]      # Error: unexpected '[' in "my_array = ["
my_array [c (, , 1:3)]        # Error in c(, , 1:3) : argument 1 is empty
my_array [dim = c (, , 1:3)]  # Error in c(, , 1:3) : argument 1 is empty

### Improvements 3 and 4: Use of formatting and reproducible code
 Answer 1:
my_array[ , , c(1,3)]
Real question #2
Question on code - Morning session 11/12/2020
Any idea why I get an integer value for consume data object when I use the for and ifelse function you used earlier?
Problem: Here there is no context or goal stated. No code is provided to be able to help, etc.
Answer2: Can you provide some context please?
(The thread went on going back and forth just to establish what the question was)
Real Question #3
rownames(mat1) <- c("bla1, Bla2, Bla3, Bla4") didnt work
Problem: Here there is no context or goal stated. The code is not reproducible, no formatting, etc. The missing quotes are obvious but with such a naive question you have to make a lot of assumptions here to be able to begin to help.
Answer #3 (very patient)
# I need more information to help you, e.g. what are you trying to do?
# What is in your data object mat1? Etc.

# If there happen to be 4 rows in mat1 and it happens to be a matrix object
# and you happen to be trying to insert row names, I think you would benefit
# trying to read and run the example code in this section of bootcamp page 1.3:

# https://dsgarage.netlify.app/bootcamp/1.3-m1-data-objects/#anchor-4

# The example relevant for this is here in that section:
colnames(mat1) <- c("A", "B", "C", "D")

# Notice how the vector is a character vector, with each element enclosed in quotes?

# Hope that helps
Several further posts
# I gave you several previous hints
# but here is the answer

colnames(mat1) <- c("bla1", "Bla2", "Bla3", "Bla4")

# I assume you have mat1 in your global environment like you said you did.
# See if you can successfully run my code.
# Then please show the output in your console when you run:

mat1
NB this help did not actually garner a response, instead a separate question was asked a bit later,
my_var1 <- c(3, 6, 12, 7, 5, 1)
my_var2 <- c(2, 3)
my_var1 + my_var2
Error: object 'my_var1' not found
Further answer
# Did you run this line of your own code?
my_var1 <- c(3, 6, 12, 7, 5, 1)
Real question #4 (By email, taxon removed to protect implication)
I'm not entirely sure what test I should be using, the data is in the form of presence-absence data (species of <TAXON1> on <TAXON2> in <PLACE>), normally for this kind of data I'd be thinking of doing a GLM, however, there are so many different combinations of species that I don't think it would work very well. Also, there are morphological data for each of the species which we are trying to link to cooccurrence. I could really use some help if you have the time, I've attached the data in question.
Two .csv data files were attached:
File 1 ~700 rows, 7 columns
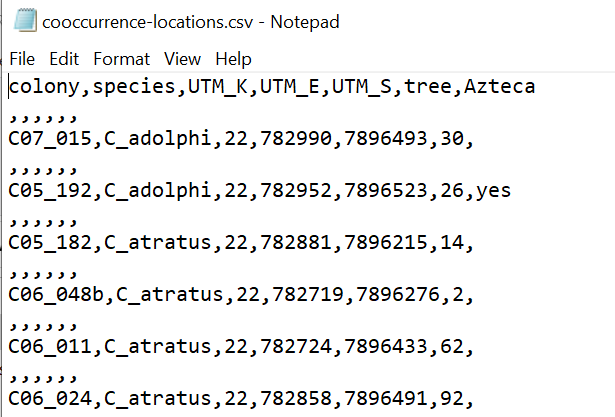
File 2 32 rows, 7 columns
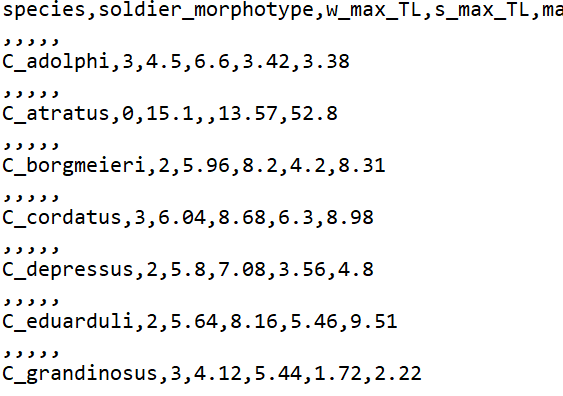
Question 4 comments:
-
Problems with data (rows blank, missing variation)
-
Really is an issue with scientific question formulation
-
Egads, where to begin?
0.3 ReprEx tips
Get a “game plan” and stick to it.
Consider a checklist for asking questions involving code, math, statistics, or data.
-
Frame the question succinctly, describing what you are trying to do.
-
Indicate a source or link if appropriate.
-
Describe the expectation and the problem or error
-
Provide reproducible code, including data object dependencies
-
Irrelevant code should not be “dumped” in a question
-
The data should be “minimal”, just enough to reproduce the problem
Notes about data
Here is a (silly) example problem to think about data. Let’s imagine there is a data frame called data, and the following error occurs.
library(lattice)
histogram(x = ~ height | Population, data = data)
> histogram(x = ~ height | Population, data = data)
Error in eval(modelRHS.vars[[i]], data, env) :
  object 'Population' not found
Let’s ignore the obvious probable cause of the error (that the name Population is probably misspelled).
Supply the code to recreate the data with dput()
# Here is the data, NB "population" with lowercase p

# RE creating the data like this is not a good idea
# because it could lead to further errors
# Need to recreate it FROM THE DATA OBJECT...

data <- data.frame(sex = c("m","m","m","m","m","m",
                           "f","f","f","f","f","f"),
                   height = c( 10.1, 9.9, 8.9, 9.5, 8.5, 8.2,
                                7.5, 8.5, 8.2, 8.3, 9.1, 8.8),
                   population = factor(c(1,0,1,0,1,0,1,0,1,0,1,0)) )
Using dput()
# We only need the height and population vars for your question

dput(data[ , c("height", "population")])
The output is not very pretty, but can be copied and pasted to exactly replicate data
structure(list(height = c(10.1, 9.9, 8.9, 9.5, 8.5, 8.2), population = structure(c(2L,
1L, 2L, 1L, 2L, 1L), .Label = c("0", "1"), class = "factor")), class = "data.frame", row.names = c(NA,
-6L))
A ReprEx question using our checklist
### Frame the question succinctly, describing what you are trying to do.
# I am trying to use the histogram() function from the {lattice} package

### Indicate a source or link if appropriate.
# Not applicable

### Describe the expectation and the problem or error
#I expect two histograms, one for each population, but I get this error:

# Error in eval(modelRHS.vars[[i]], data, env) :
#   object 'Population' not found

### Provide reproducible code, including data object dependencies
# Here is my data object and code:

data <- structure(list(height = c(10.1, 9.9, 8.9, 9.5, 8.5, 8.2), population = structure(c(2L,
1L, 2L, 1L, 2L, 1L), .Label = c("0", "1"), class = "factor")), class = "data.frame", row.names = c(NA, -6L))

library(lattice)
histogram(x = ~ height | Population, data = data)


### Irrelevant code should not be "dumped" in a question
# Not applicable

### The data should be "minimal", just enough to reproduce the problem
# Not applicable
If you need to send a data file also send a minimal script.
0.4 Bad question examples
Constructive critique of real problems can be instructive